Latest

2/4/23 | Version 9.9.0
This release provides the following new features:
- Visual change on the Table equality operator from “==” to “=”.
The following bugs were fixed:
- Strengthened site security to enforce user inputs match predefined allowed values.
- Updated Ruby libraries and dependencies.
- Fixed deprecation warning relating to password confirmation.
All News
4/28/14 | iSENSE goes to USASEF!
The iSENSE team was down at the 2014 USA Science and Engineering Festival in washington DC. We met a lot of interesting people and got to collect some cool data. We estimated pi. We determined the probabilities behind a plinko board. We even figured out where different eye colors come from .
We hope that you all enjoyed our booth and that you are looking forward to working with iSENSE. If you have any questions please contact us at [email protected]
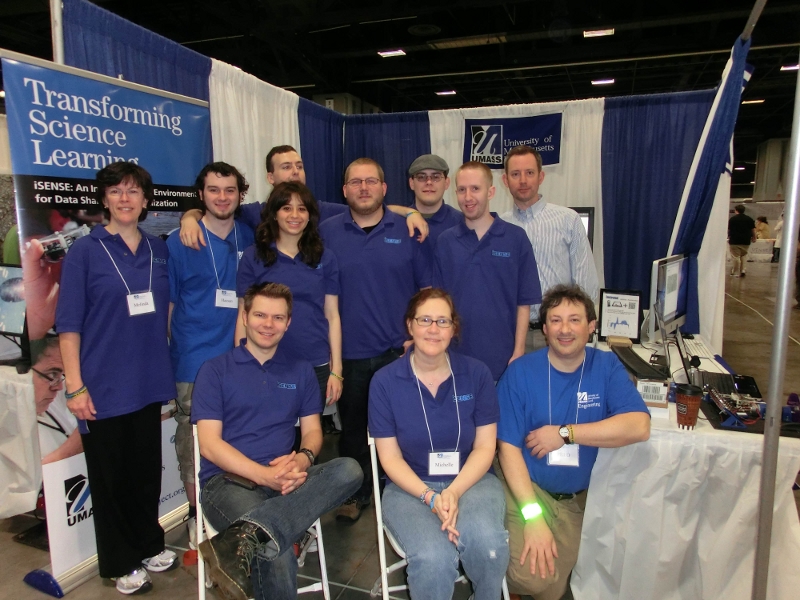
(we dont have the photo from this year yet, so this is last time) Left to right back to front: Melinda Willis, Hassan Mckusick, Chris Adoretti, James Dalphond, Mike McGuinness, Alan Rosenthal, Ivan Rudnicki, Evana Gizzi, Chris Granz, Michelle Scribner-MacLean, Fred Martin
3/28/14 | iSENSE v5.0 Release
The iSENSE web development team is committed to delivering new features, fixing bugs, and tweaking the user interface to ensure you get the most out of iSENSE. This release touches on all those points.
Sorting data sets by contributor keys
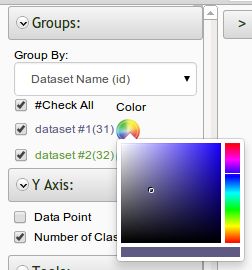
Now, you can sort data sets by contributor keys. A key will appear next to all data sets contributed with a contributor key as shown below.

The letter on the key icon corresponds to a specific key, which you can view in the drop down menu. In the example below, all data sets contributed with the C Block Biology key are labeled A, and all data sets contributed with the D Block Biology key are labeled B.

Using the drop down menu, you select and visualize data sets contributed with specific contributor keys.
This feature is perfect if you want to analyze specific groups of data sets. For example, a teacher conducting an experiment with his or her C Block Biology and D Block Biology classes may want the option to analyze each class's data separately. If the teacher distributes two different contributor keys, one key for the B Block class and another key for C Block class, he or she will be able to visualize all data contributed by each class separately.
Visualizations are now configured with better defaults centering around the data point number field
The data point number field allows for more ways to visualize data sets that do not already contain number fields. The default y axis for timeline, bar, and histogram visualizations is now only the data point number when the project contains no other number fields. In addition, bar and histogram visualizations are enabled as long as there is a least 1 data point, and row count is now the only valid analysis type on a bar visualization when data point is the only number field.
Exporting data sets
You are can now export data sets as individual files or a single concatenated file. When you click the export button, you will be asked to select one of these two options.

Introducing the color picker for visualizations
The color picker for visualizations now allows for the default color pallet to be overridden. You can select a customized color to represent that data by clicking the color wheel icon next to a data set on all visualizations.

And be sure to learn more about the iSENSE team on the Contact page.
3/21/14 | Estimate Pi by Tossing Toothpicks on a Grid
Earlier this week, Ivan and Fred met with a researcher at Tufts, Michelle Wilkerson-Jerde, who's studying how middle-schoolers create representations of data.
We mentioned a high school teacher who's using iSENSE for her kids to do statistics by "flipping" thumbtacks and counting whether they land point-up or point-down. Sort of like flipping coins, only it's not a 50/50 outcome.
Prof. Wilkerson-Jerde said it reminded her of a way of estimating pi by tossing toothpicks onto a grid of horizontal lines -- spaced one toothpick's width's apart.
Ivan's made a project based on this concept, originally proposed by 18th century by French philosopher Georges-Louis Leclerc.
Check it out:
http://isenseproject.org/projects/435
-- Fred Martin
3/21/14 | iSENSE v4.9 Release
iSENSE v4.9 offers several UI tweaks and bug fixes to improve your iSENSE experience.
iSENSE also has a new API call that allows users to append to a data set. A data set owner can append to his or her data set; project owners can append to their data sets contributed with contribution keys; and a contributor can append to a data set if his or her key is valid and matches the data set's key. For information on this new API call, please see the API documentation found here: http://isenseproject.org/api/v1/docs.
A full log of changes is here: https://github.com/isenseDev/rSENSE/compare/v4.8...v4.9
Please continue to stay tuned for a new text editor that'll replace CKEditor and the ability to sort data sets by contribution keys as well as view what data sets were contributed using contribution keys.
3/17/14 | iSENSE Professional Learning Community Meeting
Our next iSENSE Professional Learning Community meeting will take place on Thursday, March 27, at 4:30 PM. At this meeting, we will present information about the upcoming Science of Rivers field trips to the Merrimack River in Lowell MA. We have funding to provide field trips this May and June for your middle and high school environmental science and biology students. Please come to this meeting if you want to bring your students on our field trip!
Details
Thursday, March 27
4:30p – 6:30p
UMass Lowell North Campus, Olsen Hall room 311
Registration
Agenda
1. Dinner and conversation! A catered dinner is provided to all.
2. Review of the "Science of Rivers" iSENSE field trip.
This is a one-day field trip, offered at UML's Bellegarde Boathouse, designed to introduce middle school and high school students to the science of water quality testing.
It's offered in collaboration with the Tsongas Industrial History Center (TIHC) and the National Park Service.
The Science of Rivers field trip includes a boat excursion on the Merrimack River and hands-on water quality testing and data analysis activities at the boathouse using iSENSE.
Representatives from TIHC will explain the field trip activities, as well as the logistics involved in bringing your students on the trip (dates available, boathouse program, and number of students).
3. Review of a classroom data analysis activity that precedes the field trip.
Teachers bringing students on the Science of Rivers field trip will be required to devote at least one class session to a pre-trip activity.
The pre-trip activity should be conducted in a computer lab at your school. It will introduce students to water quality science and data visualization using iSENSE. No software installation is required—just use of a web browser to access iSENSE.
Participants at the March 27 meeting will participate in a draft version of the pre-trip activity.
4. Other ideas for using iSENSE in your classroom. We'll talk as a group about how you can use iSENSE with your students.
Please register now if you can come!
3/7/14 | iSENSE v4.7 Release
Along with several UI improvements and bug fixes, iSENSE release v4.7 introduces a new privacy policy and virtual data-point number field for visualizations.
- Take a moment to review our privacy policy, which can be found here.
-
Every row of data in a data set now automatically has its own virtual data point ID number, which allows for more ways to visualize data sets that do not already contain number fields. For example, if a data set has 5 rows of data, each row of data will have the data point ID number 1, 2, 3, 4, and 5, respectively. Additionally, while visualizing multiple data sets, you can group by combined data sets to combine rows of data with the same virtual data point ID number.
Looking ahead, iSENSE users should get excited about the following new features soon to come.
- Users will soon be able to view which data sets were contributed using contribution keys and sort data sets by contribution keys.
- A new call to append to data sets will soon be added to the API. More details on this call will be added to the API documentation in the next few weeks.
- A new and improved text editor will soon replace ckeditor.
2/28/14 | iSENSE v4.6 Release
This release of iSENSE includes the following:
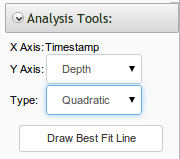
- Quadratic regressions on Timeline: Quadratic regressions are now available on timeline visualizations. Options to draw regressions are available in the visualization toolbar as shown below.
- Table visualization enhancements: The table visualization UI has been improved and sorting is now working properly. Users can click on column headers to sort data in ascending and desending order. Please note timestamps are sorted by date.
- An important reminder to users on Internet Explorer 9 and below: We only support Internet Explorer 10 and above. We recommend installing the latest version of Internet Explorer or switching to another browser, such as Chrome or Firefox, for optimal compatibility.
2/21/14 | iSENSE Professional Learning Community Meeting
If you would like to integrate data analysis and visualization into your science, math, or engineering teaching, please come to our iSENSE Teacher Network meeting!
You will learn about iSENSE, a free web tool for uploading, sharing, and visualizing data. iSENSE is great for making sense of manually and electronically gathered experimental data, statistical data, and geocoded information.
At Teacher Network meetings, you will:
- hear from teachers about how they’ve been using iSENSE in their classrooms
- participate in a tutorial about how to use iSENSE
- discuss approaches for your own classroom with peers and university education faculty and students
- meet the technical team and get assistance for your own ideas about how to use iSENSE!
All meetings include dinner.
Our next meeting is Thursday February 27 at 4:30p! See more information and sign up here:
2/21/14 | iSENSE Release v4.5
Along with several UI improvements, this iSENSE release has much to offer.
- Drawing best fit lines on graphs with multiple data sets has been significantly improved.
- Users can now upload Vernier files (.qmbl) to iSENSE. If you collect data using a Vernier device, such as the Logger Pro, you can upload and analyze your data on iSENSE.
- A new call (/api/v1/users/myInfo) has been added to the API. For more information, please check here: http://isenseproject.org/api/v1/docs
2/14/14 | iSENSE v4.4 Release
This release offers several UI enhancements, including more tooltips and improved project toggle buttons.
Additionally, users can now contribute data to locked projects with contribution keys. A contribution key is like a password created by project owners and distributed to users without accounts who seek to contribute data. Contribution keys are ideal for teachers who wish to use iSENSE in the classroom without hassling their students to manage accounts. Users can create and manage contribution keys by clicking the Edit button on a project's page as shown below.
